Analysis
Diversity of Project Areas
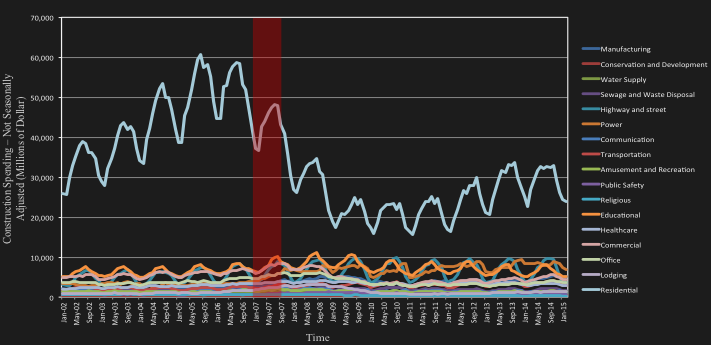
Diversity of project areas is important for the construction companies along with the size of total construction spending, as it suggests that companies can diversify in case of external and internal shocks in any specific sub-industry such as the housing crisis in 2007. An overview of the breakdown of total construction spending includes 16 categories of construction project areas. Residential construction comprises a major proportion of the dollar value put in place each month as can be seen in the graph below. This graph is based on the total construction spending which is not seasonally adjusted (i.e., it presents actual spending for each month and reflect seasonal fluctuations).
The below graph presents total construction of project areas except residential to show fluctuations which were not observable in the above graph.
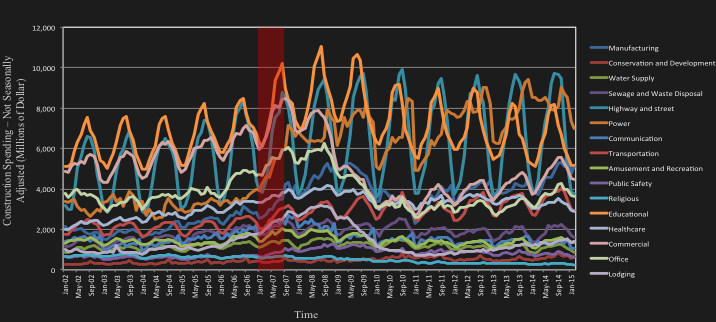
As it can be observed, 2007 (indicated by the red box) is a turning point in the dynamics of total construction spending. In order to gauge diversity of project areas, a multivariate analysis was conducted to explore the impact of diversity indices on future performance of the industry. The analysis used Gini-Simpson of the construction spending, the percentage of the residential construction in construction spending, the minimum number of specialties that constitute more than 75% of the construction spending, and the ratio of changes in the diversity to changes in the construction spending are used as independent variable. The analysis indicated high correlation between diversity measures and one-month lagged performance of construction industry indicates through S&P Building and Construction Select Industry Index.
Trend of Diversity of Construction Specialties
Diversity can be gauged in different ways such as:
- the Gini-Simpson of the total construction,
- the percentage of the residential construction in the total construction, and
- the minimum number of specialties (project areas) that constitute more than 75% of the total construction spending.
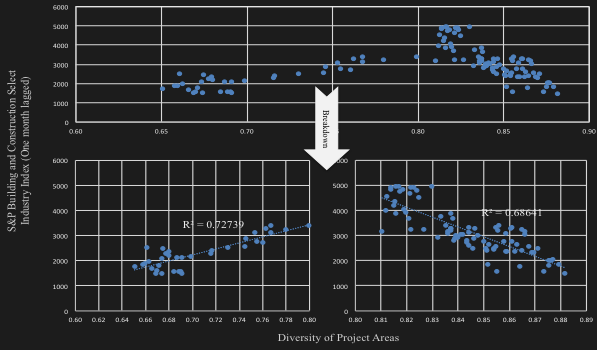
Regression of Gini–Simpson against the Standard & Poor’s (S&P) Building and Construction Index may help in understanding of relation of diversity to profits in the construction industry. The S&P Select Industry Index is an average of the measured performance of a minimum of 35 stock data from the Building and Construction Index. The results of the regression indicates different patterns of correlation for diversity rates below 0.8 and above 0.8. As the diversity rates below 0.8 were associated with the pre-2007 market crisis, the negative trend observed in the diversity range above 0.8 may be attributed to the pre-existing condition of the markets and the efforts to revive it through diverse project investments. In order to confirm this breakdown, two tests were performed: the Chow test and the likelihood ratio test. These statistical tests confirmed the break-down in the regression and the hypothesis that the dynamics of the market were substantially different before and after 2007. The graphs below show the result of the regression along with the separated regressions that clearly describes dynamics for each period.
A multivariate analysis was then conducted to explore the impact of diversity indices on future performance of the industry. The analysis used Gini-Simpson of the construction spending, the percentage of the residential construction in construction spending, and the minimum number of specialties that constitute more than 75% of the construction spending as independent variable. The analysis indicated high correlation between diversity measures and one-month lagged performance of construction industry indicates through S&P Building and Construction Select Industry Index. The Gini-Simpson exhibited the highest correlation and used in Pi-C to gauge diversity of project areas.

The graph above shows seasonally adjusted construction spending while the graph below shows the trend of diversity of project areas.
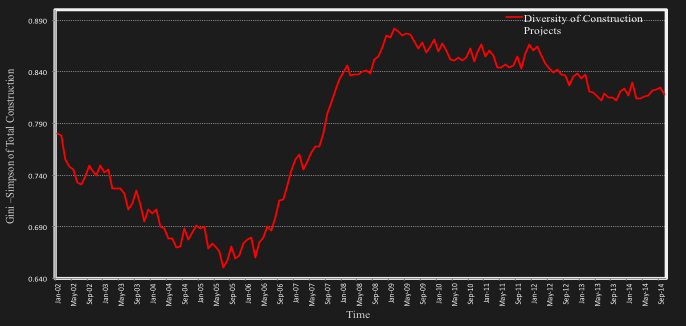
Again as it can be observed from both of these graphs, the dynamics of the market has changed substantially since 2007 with increased diversity of project areas and substantial decrease in the residential construction market.
This model investigated the hypothesis that the diversity of the project areas contributes to the future performance of the industry. The diversity of the project areas is important for construction companies along with the size of the total construction spending because it suggests that companies can diversify in the case of external and internal shocks in any specific project area such as the housing crisis in 2007 and can spread the risks. The data are used during the time period between November 2004 and October 2014. As shown in above figures, the diversity of construction specialties showed two different pattern of correlation: the growing trend of S&P index until 2007 and the decreasing trend of S&P index after 2007.